
Gold Drops Sharply: Is the Rally Over?
Gold prices plunged more than 6% on Tuesday, marking the largest single-day decline in over 12 years, as this year’s record-breaking rally reversed sharply following the Diwali buying season. After hitting an all-time high of $4,381.52 per ounce on Monday, prices dropped 6.3% to $4,082.03 the following day, in what many see as a long-awaited correction.
The scale of this move is remarkable: a rare 4.46-sigma event. In statistical terms, such swings should only occur about once every 240,000 trading days under normal market conditions.
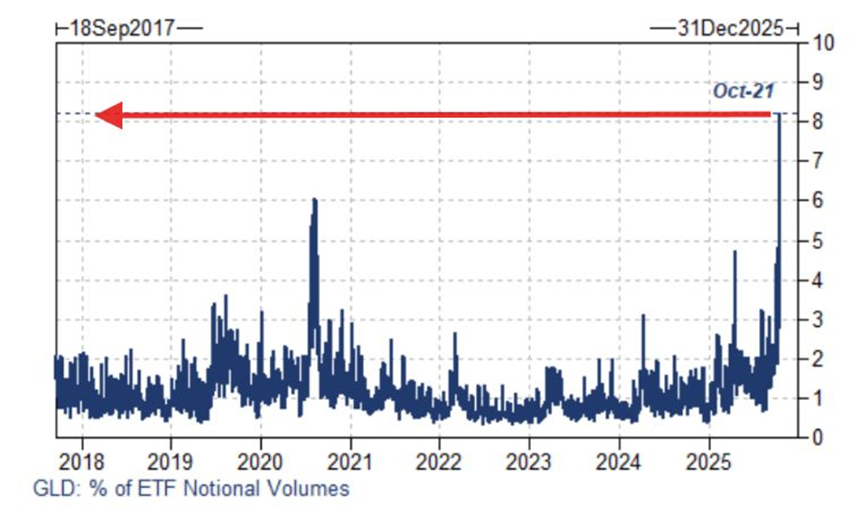
Goldman Sachs put it bluntly: “The best answer we have for the largest percentage move in 10 years is simply positioning, and the fact that we have been up for nine consecutive weeks. The ease of trading ETFs to gain rapid exposure was clearly on display; as of the close [on Tuesday], GLD accounted for 8% of the total notional volume of U.S.-listed ETFs — the highest activity share in our dataset. ETF trading desks saw flows skew heavily (unsurprisingly) toward selling today.”
Long-Term Outlook for Gold
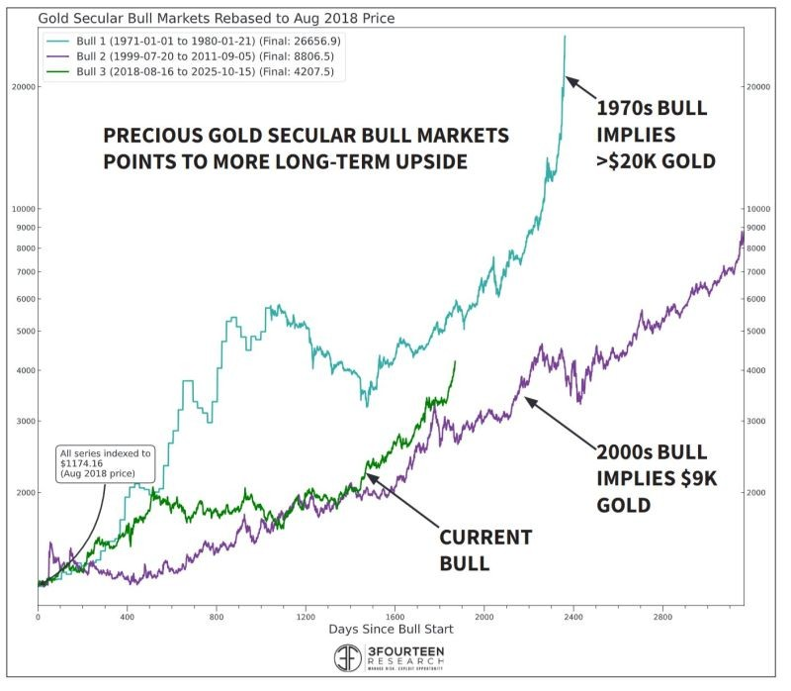
The current gold bull market is trending higher than the rally in the early 2000s but below the surge seen in the 1970s.
The two most recent major bull markets peaked at critical crisis moments:
January 1980: at the height of prolonged stagflation concerns
September 2011: just after the U.S. credit rating downgrade by S&P
The current bull market looks more like 2011 than 1980. History doesn’t repeat, but it often rhymes.
U.S. Earnings Season Smashes Expectations Across the Board
The percentage of U.S. companies beating earnings expectations this quarter is the highest since 2021. Roughly 85% of S&P 500 companies reporting Q3 results so far have exceeded profit forecasts.
But first, let’s take a look at one of the many recent headlines about a “gold bubble” that have begun to surface. In this article, the analyst references his “bubble view” from a paywalled report. However, a writer at Investing.com publicly highlighted the analyst’s stance.
Gold’s record-breaking rally could soon unravel, according to John Higgins, Chief Markets Economist at Capital Economics, who has warned that the metal’s price has surged far beyond its “fair value” and may now be in bubble territory.
Gold is in desperate need of a correction. The correction may or may not be over. That is the work we will conduct separately, in NFTRH.
But what exactly is this “fair value” you speak of, sir?
“At the start of 2025, the gold price was close to its previous peak in real terms, which it had reached back in 1980,” he wrote in a note.
“But now, the real gold price is nearly 60% above that peak, and more than triple its average since 1980.”
While gold’s long-term role as a store of value is unquestionable, Higgins argued that the recent surge cannot be justified by the usual drivers such as lower real bond yields or high inflation.
“Since gold pays no interest, the opportunity cost of holding it falls when the yields on such bonds decline. But those yields have generally risen,” he said, noting that the once-tight relationship between Treasury Inflation-Protected Securities (TIPS) yields and gold prices has “broken down in recent years.”
He is essentially following Harvey & Erb. Creating a rule that gold must maintain a relationship with traditional bond market signals about inflation or disinflation. That is conventional analysis assuming that what has happened before (falling inflation trends in long-term yields up to 2022) will continue. But it has not — and will not.


Leave a Reply